

The apps
Every tilt of the radar, on every device you own.
The site hands you the warning and the mosaic. The app hands you the whole volume scan, every storm cell scored while it is still a cell, and alerting that follows you instead of a list of addresses.
- 40s
- Median, forecaster send to broker
- 157
- NEXRAD sites, every tilt
What you open it for
More detail than most apps
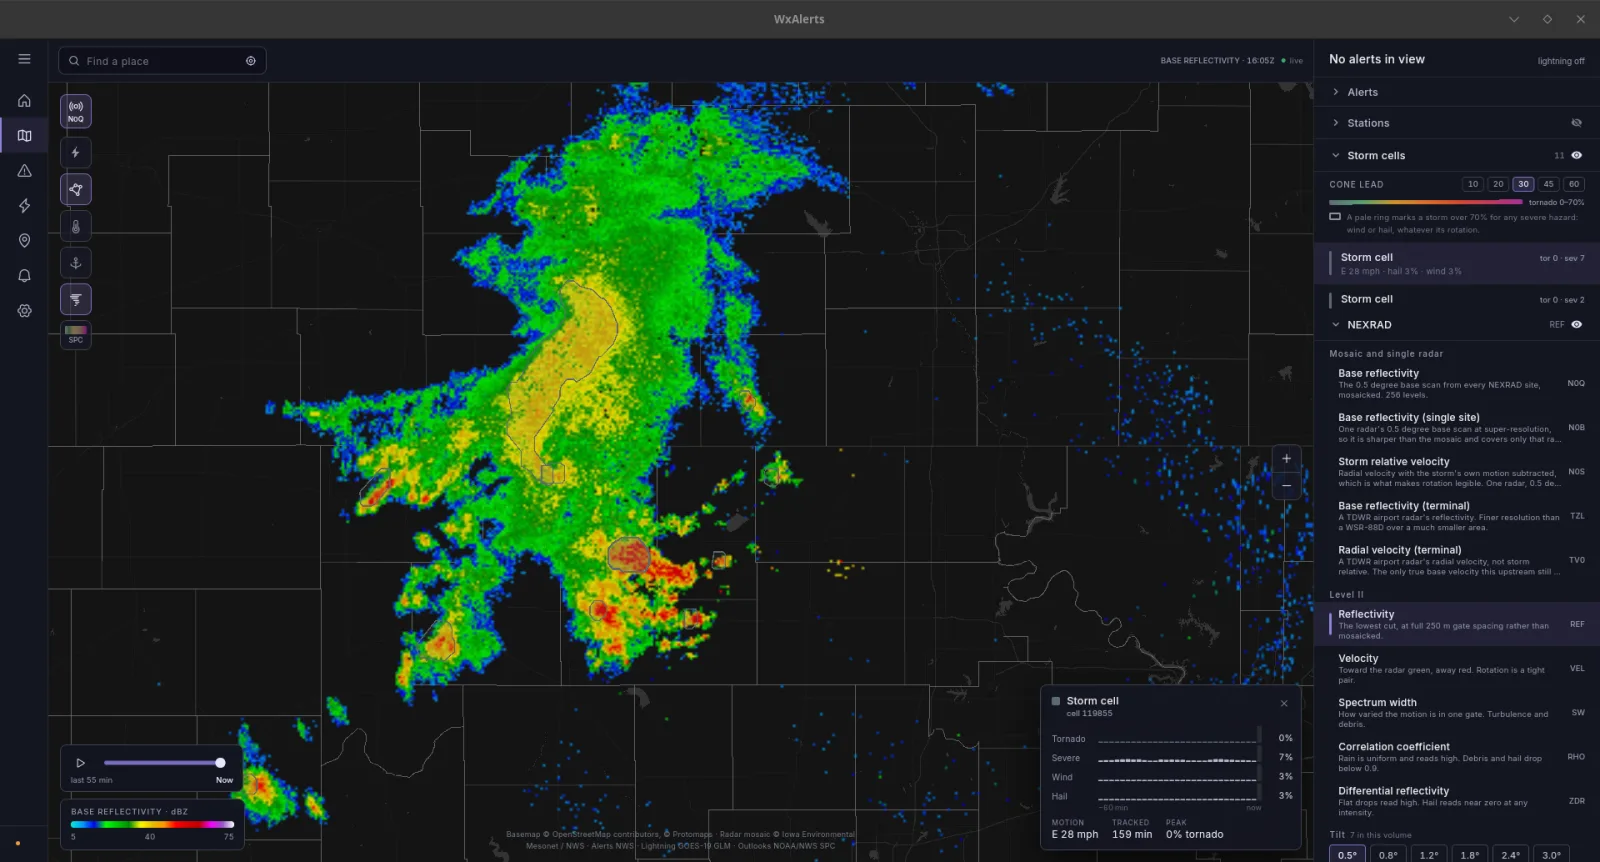
Phone: Level II reflectivity with the tilt picker open
The whole volume scan, not a flattened picture of it
The app holds its own connection to our Level II service, so you get every elevation angle and every product the radar puts out. Climb a storm tilt by tilt and find the rotation at the height it is actually happening, instead of guessing from the lowest slice. This is the part that cannot be a web page: the site draws Level III tiles at the 0.5 degree cut, and it always will.
Level II is served to the apps from l2.wxalerts.org. The website renders Level III tiles and never Level II, which is why this page is where the claim lives.
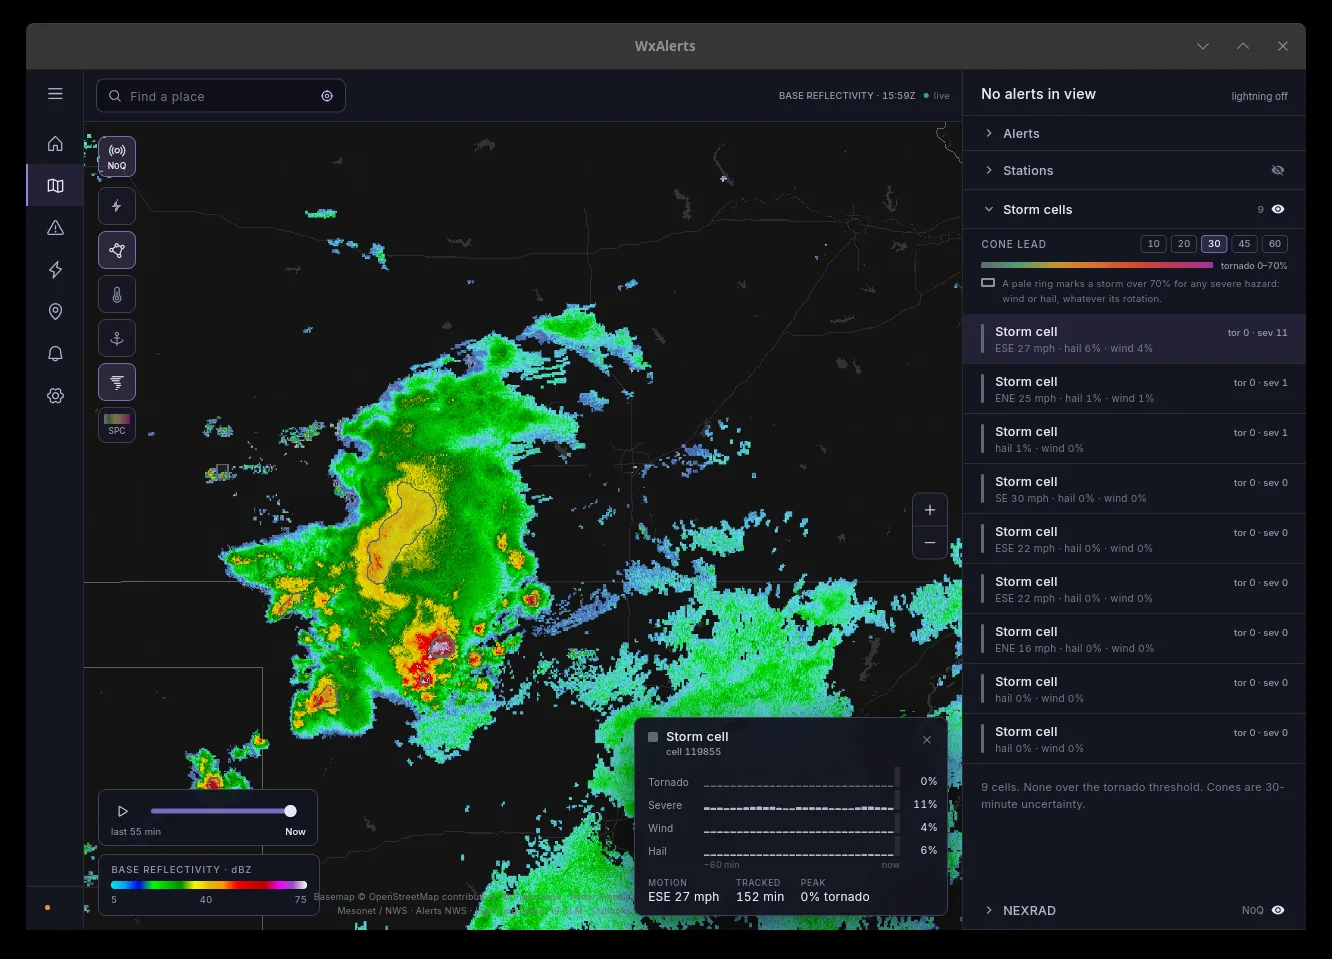
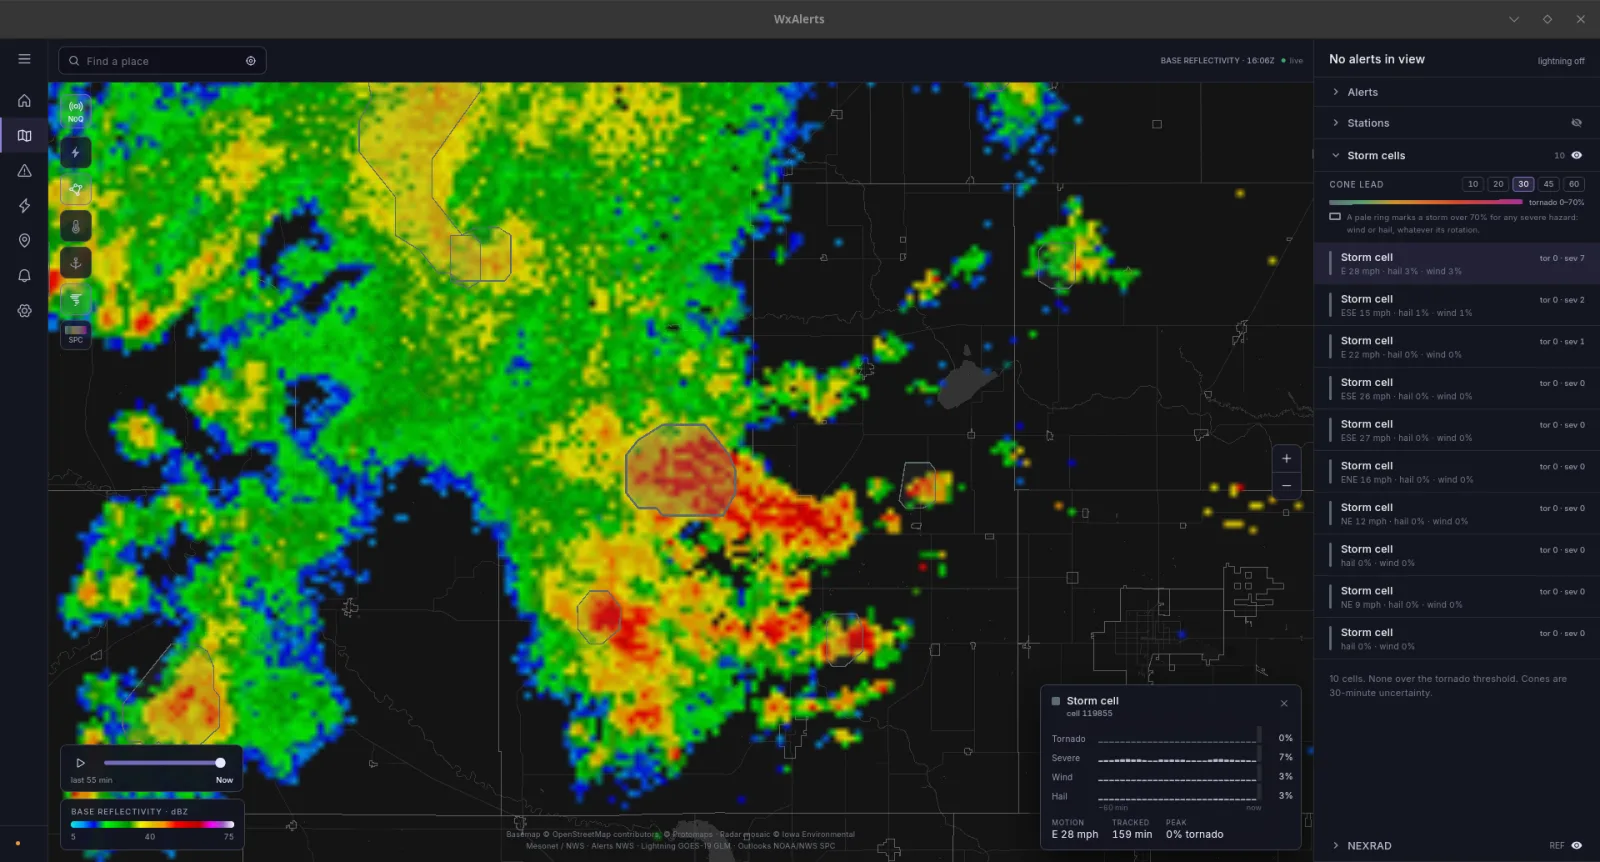
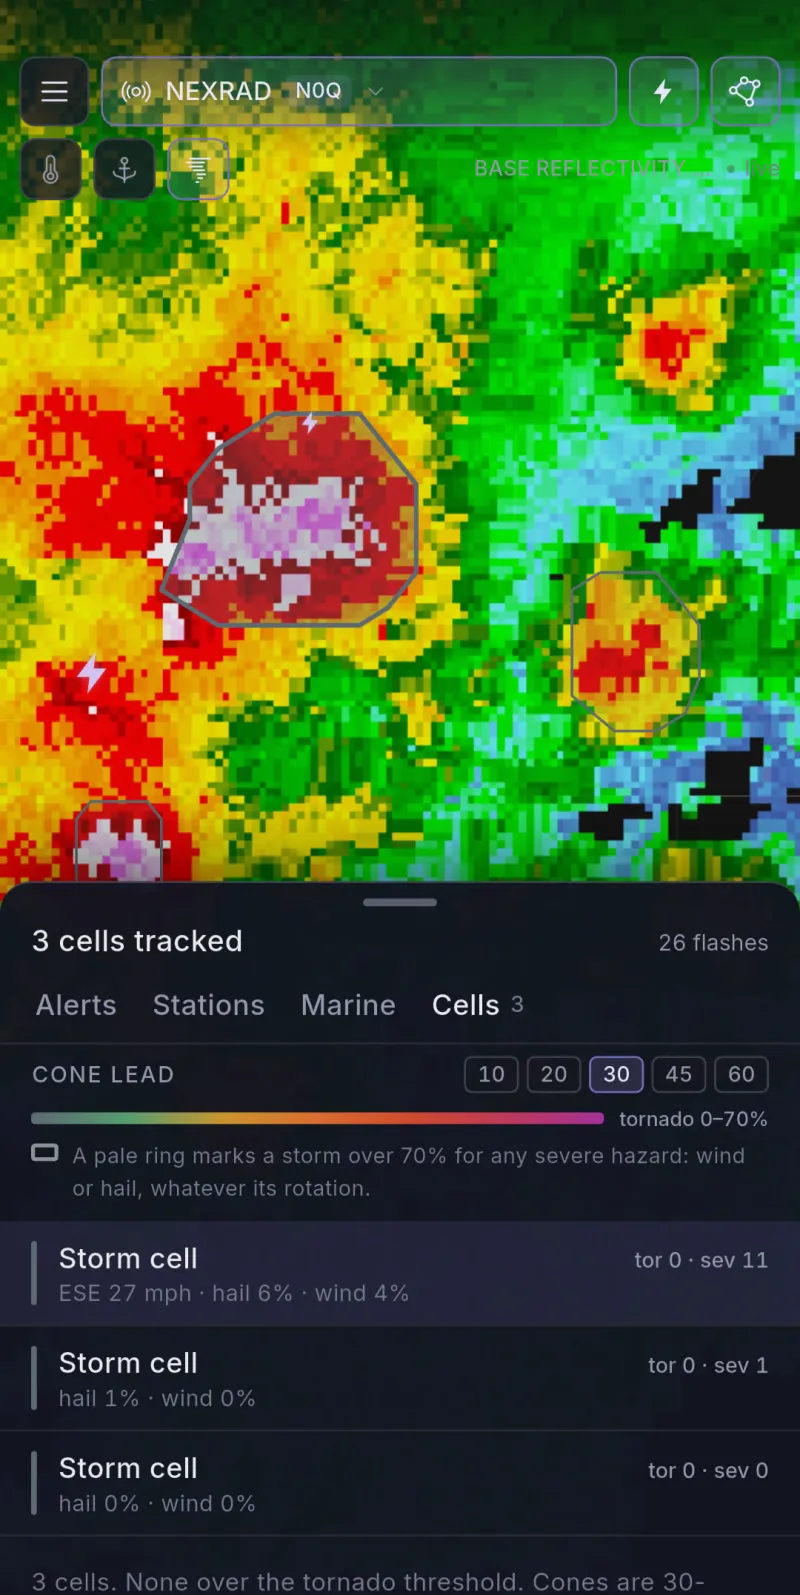
Every cell tracked and scored while it is still a cell
Each convective cell carries a severe probability, a rotation probability and its own motion, refreshed every couple of minutes. Tap one for where it has been, where its motion puts it next, and how hard it is working to get there. It says rotating, with a high probability of damaging wind, hail or a tornado. It never says tornado detected, because that is not a claim the data supports.
The probability scale tops out at its observed ceiling rather than at 100, because a scale implying 100 is reachable makes every real storm look mild. How it works, and how well, is written up in the docs.
Desktop: follow mode with the position marker, its heading, and a warning polygon ahead
Phone: follow mode centred on the user with a warning polygon ahead
Saved places cover the house. The app covers you
A list of addresses cannot answer the question you have while driving toward a storm. Turn on follow and the app keeps the map on your position and tests every warning polygon against where you actually are, so you are told when you cross into one rather than when a county line moved.
Saved places and their rules still do the waking when the app is closed. Follow is the extra case, for when you are not at any of them.
Desktop: the live map with the spotters-in-the-field layer on and a report open
Phone: the spotter camera in storm mode, compass tape and reticle over the preview
File what you saw, from where you saw it
A certified spotter files from the app, in the weather that produced the report. The camera reads the compass while you aim it, so what you send carries the direction you were actually looking rather than one recalled afterwards, and the hail form speaks in the reference objects a spotter already uses.
Spotter reports are unofficial and are never National Weather Service reports. A photograph travels with the report to us and is not published on the live map.
Desktop: the per-place alert rule matrix, hazards by channel
Phone: a lock screen carrying a tornado warning
A warning on a muted phone is not a warning
Every place you save gets its own rules, channel by channel and hazard by hazard: call for a tornado, text for a thunderstorm, push for an advisory. We take the National Weather Service on three independent feeds and send whichever arrives first, so one feed going quiet does not take your warning with it.
Route one place to more than one person, so the alert reaches whoever is actually standing there at 3 AM.
Desktop: the SPC Day 1 categorical outlook with a probability layer and a mesoscale discussion
Phone: the SPC outlook with the day selector and the risk legend
Tomorrow, in the Storm Prediction Center's own colors
Convective outlooks with the categorical ladder and the probability layers for tornado, wind and hail, plus watches and mesoscale discussions. Drawn in SPC's colors rather than ours, so a Moderate Risk looks like a Moderate Risk to anyone who already knows what one is.
Outlook, watch and mesoscale discussion products from the NOAA Storm Prediction Center, drawn as issued.
Desktop: the station layer with station plots and one station time series open
Phone: the nearby stations list with current conditions
What the air is actually doing, under the storm you are watching
Stations, buoys and a temperature map over the same view, so you can watch a gust front cross the mesonet ahead of you instead of inferring it from reflectivity. Tap any station for its own page and its last 24 hours. Connect your own and it joins the network other people are reading.
Observations from NWS and FAA ASOS/AWOS sites, state mesonets, NDBC buoys and contributing personal stations.
Get it
We cover everyone, including Linux

What it costs
The app is free. Level II is not.
Warnings, storm analysis, outlooks, stations and push are in the free app on every platform, with no ads and nothing that keeps you safe behind a paywall. Level II is the exception and it is on Pro and up: every tilt of every site is a radar feed we pay to move, and it is the one thing here that costs us more the more you use it. A plan also buys capacity: more places to watch, more people to wake, and the channels we pay for per message.